Note
Click here to download the full example code
Visualize results of cluster-based tests
This example demonstrates the basic functionality of
borsar.cluster.Clusters to visualize cluster-level effects.
# Author: Mikołaj Magnuski <mmagnuski@swps.edu.pl>
# License: BSD (3-clause)
We’ll first download borsar example data.
from borsar.utils import download_test_data
download_test_data()
We are going to read the clusters object from a .hdf5 file.
The file we are trying to read represents results in channel by frequency
space so we will need to additionally attach an mne info during reading.
Let’s first create the info object:
import mne
mntg = mne.channels.read_montage('easycap-M1')
info = mne.create_info(mntg.ch_names, sfreq=250., ch_types='eeg', montage=mntg)
Now we read the file.
import os.path as op
from borsar.utils import _get_test_data_dir
from borsar.cluster import read_cluster

data_dir = _get_test_data_dir()
fname = op.join(data_dir, 'chan_alpha_range.hdf5')

clst = read_cluster(fname, info=info)
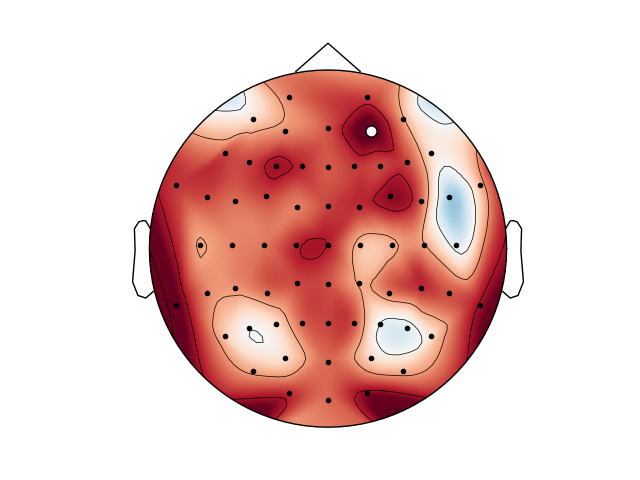
First let’s plot the topography of the second cluster’s effect in frequency range from 8 to 8.5 Hz:
topo = clst.plot(cluster_idx=1, freq=[8, 8.5])
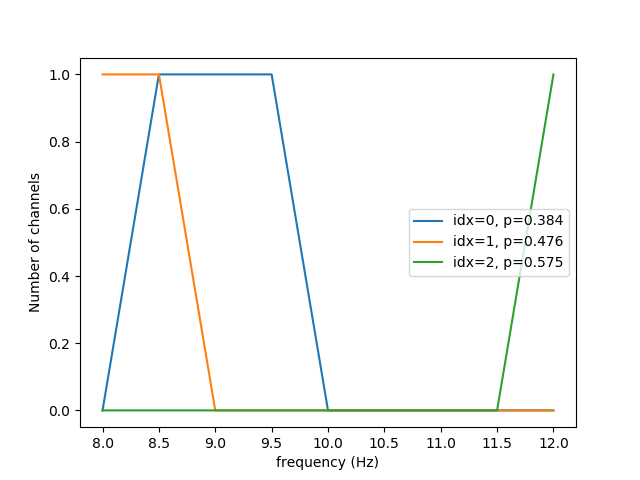
We can also see how specific frequencies contribute to each cluster by the number of channels participating in each cluster at given frequency:
clst.plot_contribution('freq')
Total running time of the script: ( 0 minutes 5.288 seconds)